
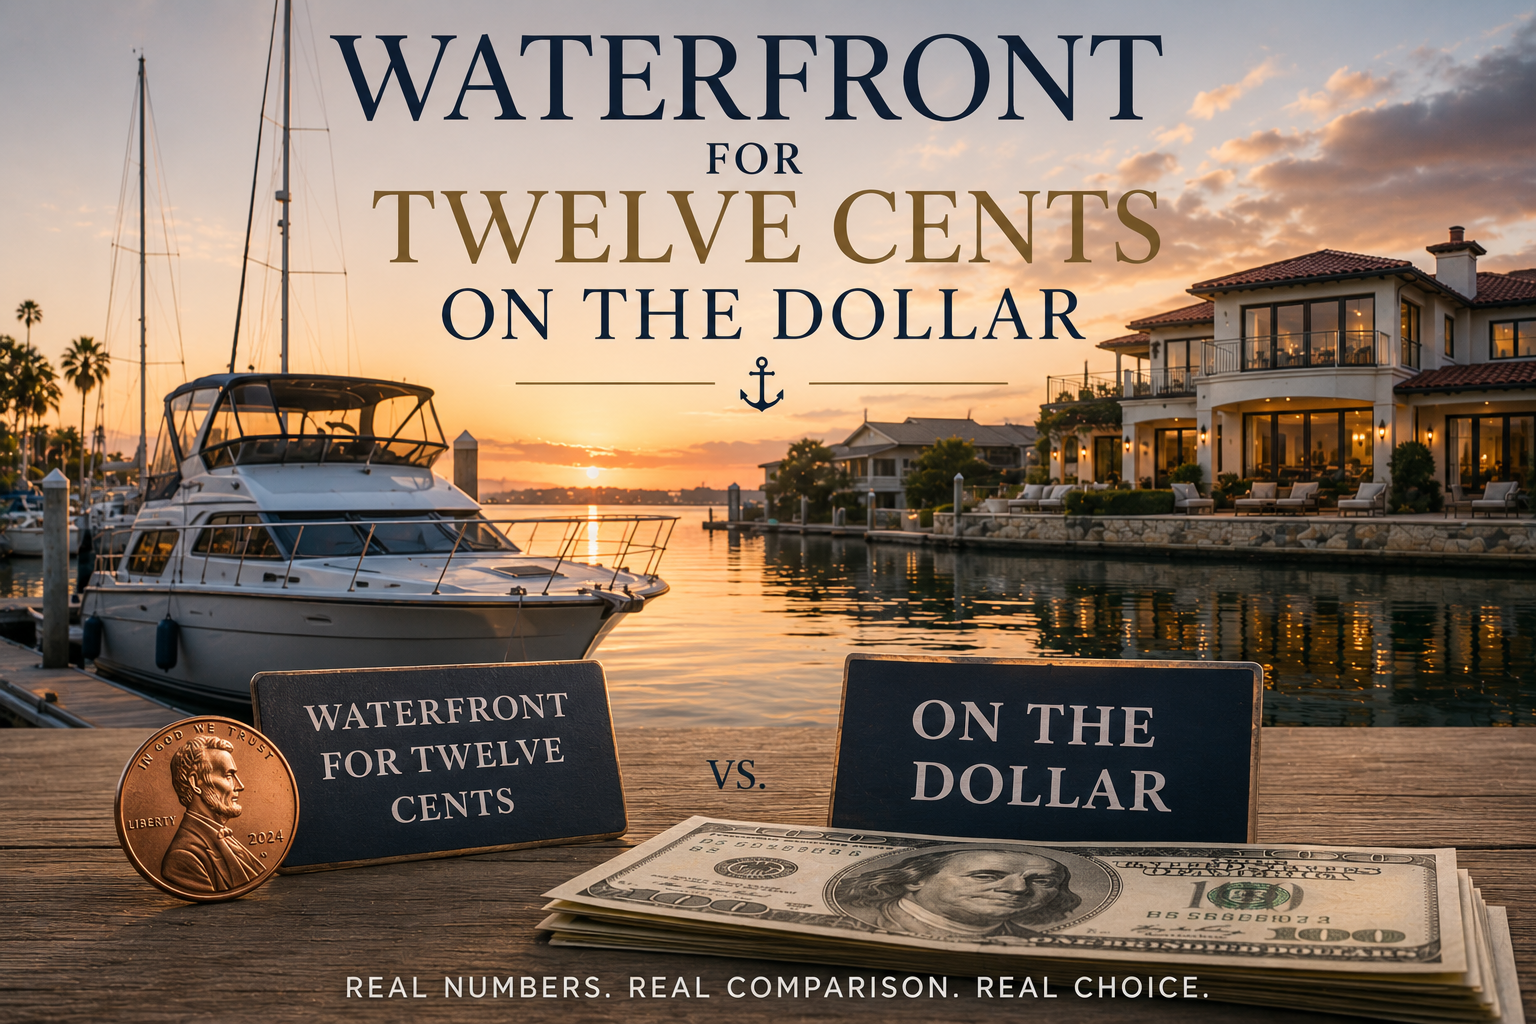
What Living on the Water in Santa Barbara Actually Costs — A Ledger, Not a Lifestyle Pitch
The Floating Residence | Market Intelligence Editorial | July 2026
Disclosure: The case examined in this analysis is the author’s own. The author has lived aboard a 35-foot vessel in Santa Barbara Harbor since 2018 and holds a slip permit issued by the City of Santa Barbara Waterfront Department. All figures for the floating residence position are actual, drawn from the author’s records. All housing market figures are cited to third-party sources. Readers should verify current harbor policies, fees, and transfer rules directly with the City of Santa Barbara before relying on any figure herein.
Housing analysis usually deals in hypotheticals — model buyers, assumed rates, illustrative budgets. This piece does something different. It puts one real floating residence, with its actual acquisition costs and actual monthly ledger, next to the published cost of buying a house in the same city, financed at this week’s actual mortgage rate.
The city is Santa Barbara, California — by most measures one of the least affordable housing markets in the United States. The floating residence is a 2008 35-foot Meridian moored in Santa Barbara Harbor.
The result is not close. But the point of this analysis is not the size of the gap. It is understanding precisely what the gap buys, what it costs, and what it doesn’t — because the honest version of this comparison is more useful than the flattering one.
I. The Market Context: What “Living in Santa Barbara” Costs on Land
Start with the land-side numbers, all from mid-2026:
In May 2026, the median sale price for a house in the City of Santa Barbara was $2,160,000, with an average of $2,700,742, per County Recorder data reported by Fidelity National Title. Across the South Coast, the median house sale was $2,312,500.
That’s the citywide figure — most of it inland. Proximity to the water escalates the number quickly. Redfin’s data for Santa Barbara’s Waterfront neighborhood shows average house prices near $2.96 million. The premier coastal enclaves occupy another tier entirely: Montecito’s May 2026 median house sale was $5,600,000 (average: $7.3 million), and Hope Ranch sales averaged $7,140,000. Genuinely beachfront property in this market starts around $5 million and runs well past $20 million; April’s highest South Coast sale was a Montecito estate at $59.9 million.
Renting doesn’t escape the gravity. Average rent in Santa Barbara runs approximately $2,836 per month — for an average unit, not a waterfront one.
Financing costs complete the picture. As of July 9, 2026, Freddie Mac’s average 30-year fixed mortgage rate stands at 6.49%.
Hold those numbers.
II. The Position: One Floating Residence, Itemized
The floating residence in this case study consists of two assets acquired together and sellable together:
| Component | Cost |
|---|---|
| 2008 Meridian 35′ motor yacht | $150,000 |
| Slip rights, Santa Barbara Harbor (incl. City transfer fees) | $109,000 |
| Total capital position | $259,000 |
Two features of that second line deserve emphasis, because they are what separate this position from nearly every other form of alternative living. First, Santa Barbara Harbor slips are transferable — the slip right conveys with the vessel in a sale, which means the $109,000 is not a fee paid for access but capital deployed into a scarce, tradeable asset. Second, the harbor is geographically landlocked: roughly a thousand slips, no expansion possible, permanent excess demand. The slip’s value rests on the same supply constraint that makes Santa Barbara real estate expensive. The difference is the entry price.
The monthly operating ledger:
| Line item | Monthly |
|---|---|
| Slip fee (paid to City of Santa Barbara) | $579.05 |
| Electricity | $7.36 |
| Water | $0 (included) |
| Maintenance & insurance (budgeted average) | ~$500 |
| Property/vessel taxes (~$3,500/yr, monthly equivalent) | ~$292 |
| Total monthly carrying cost | ~$1,378 |
Roughly $16,500 per year, all-in, to live on the water — not near it — in Santa Barbara, with no mortgage and no landlord.
One line above requires honest annotation, and we’ll return to it in Section V: the ~$500 maintenance-and-insurance figure is a budgeted average, and marine maintenance does not arrive in averages. It arrives in lumps.
III. The Comparison: The Same City, Bought at the Median
Now construct the land-side equivalent — the median Santa Barbara house at $2,160,000, purchased with a conventional 20% down payment and financed at Freddie Mac’s current 6.49%:
| Line item | Amount |
|---|---|
| Down payment (20%) | $432,000 |
| Loan amount | $1,728,000 |
| Principal & interest (30-yr fixed, 6.49%) | ~$10,910/mo |
| Property tax (~1.1% effective) | ~$1,980/mo |
| Homeowner’s insurance (est., CA coastal market) | ~$500/mo |
| Maintenance (1% of value annually, standard assumption) | ~$1,800/mo |
| Total monthly carrying cost | ~$15,190/mo |
Roughly $182,000 per year to carry the median house — which, at the median, is not on the waterfront and does not have a water view.
Set the two ledgers side by side:
| Floating residence (actual) | Median SB house (modeled) | |
|---|---|---|
| Capital required | $259,000 (total, owned outright) | $432,000 (down payment alone) |
| Debt | $0 | $1,728,000 |
| Monthly carrying cost | ~$1,378 | ~$15,190 |
| Annual carrying cost | ~$16,500 | ~$182,000 |
| Distance to the ocean | Zero — in the harbor | Median: not coastal |
The ratios, stated plainly:
- The monthly cost of the floating residence is about 9% of the cost of carrying the median house — twelve cents on the dollar, rounded generously toward the house.
- The entire floating residence position — vessel, slip rights, everything, owned free and clear — costs 60% of the house’s down payment alone.
- The house’s annual carrying cost exceeds the total value of the floating residence position roughly every seventeen months. Every year and a half, the median homeowner spends the boat-and-slip. Perpetually.
- Against renting, the position wins too: total monthly cost of ~$1,378 is less than half the city’s average rent of $2,836 — and the average rental is not in the harbor.
And the inversion worth pausing on: at the median, the $2.16 million buys a house that is near Santa Barbara’s coastline. The $259,000 position is on it — inside the harbor, closer to the water than any residential parcel in the county can legally be. In this market, the dramatically cheaper position is also the more waterfront position. That almost never happens in real estate, and it happens here because the two assets are priced by entirely different markets that happen to share a shoreline.
IV. The Opportunity Cost: The Invisible Half of the Ledger
The monthly comparison understates the real difference, because the largest number in this analysis never appears on a monthly statement.
The house requires committing $432,000 in cash and servicing $1.7 million in debt. The floating residence requires $259,000, total, once. The difference — the capital not committed, the debt not carried — is the invisible half of the balance sheet, and it is where the Opportunity Cost Framework™ does its work.
Consider only the down-payment differential of roughly $173,000, plus the ~$165,000 annual carrying-cost differential. In the first year alone, the floating residence path leaves approximately $340,000 of capital undeployed into housing. Conservatively invested, the annual carrying-cost savings by themselves — $165,000 per year — exceed what most American households earn. Left in a diversified portfolio at historically ordinary returns, the ten-year divergence between the two paths is measured in millions, before any assumption about home appreciation is allowed to argue back.
Home appreciation will argue back, and it deserves the floor. Which brings us to the section this analysis would be dishonest without.
V. The Honest Ledger: What the House Has That the Boat Doesn’t
An analysis that names only its advantages is marketing. Here is the other column.
The house is a better asset. Full stop. The homeowner holds appreciating land with 4:1 leverage, mortgage-interest deductibility, a Prop 13 tax basis that improves with every year held, and membership in an asset class with the deepest price history in American finance. Santa Barbara’s structural undersupply — the same scarcity powering the slip’s value — supports long-run home appreciation; local forecasts for 2026 project moderate continued growth. If the question is “which position builds more net worth over thirty years for someone who can comfortably afford either,” the house probably wins, and this publication will not pretend otherwise.
But notice what that framing assumes: a buyer with $432,000 liquid and $15,000 a month of carrying capacity. For every household without those numbers, the real-world comparison was never boat-versus-house. It was boat-versus-renting-at-$2,836, or boat-versus-leaving-Santa-Barbara. Against the alternatives most people actually face, the floating position wins on access, wins on capital efficiency, and — uniquely among alternatives — retains an exit.
The vessel depreciates. A 2008 motor yacht will be worth less in ten years than today; that is the nature of the asset. The position’s exit value rests on the pair: a depreciating vessel attached to an appreciating, supply-capped slip right. The slip is the store of value. The boat is the cost of admission.
Maintenance is lumpy, and the average conceals the lumps. The ~$500 monthly figure is a fair long-run budget, but marine ownership does not bill smoothly. A haul-out year — bottom paint, zincs, survey, the inevitable discoveries once the hull is out of the water — can multiply that year’s maintenance line. Engine work, canvas, electronics, and plumbing arrive on their own schedule and in four figures. One structural mitigant deserves note, because it inverts the van-life problem: a vessel that stays in its slip can defer propulsion-system work almost indefinitely. In a van, the engine is the foundation of the home — a breakdown is a housing emergency. In a slip-based floating residence, the engine is elective; the non-negotiable layer (through-hulls, bilge pumps, dock lines, moisture management) is smaller and cheaper. The boat lets its owner choose what to defer. The van chooses for you. Still: any prospective liveaboard should budget for the lumpy version of this line, not the smooth one.
The counterparty is a harbor district, not a market. The slip fee — $579.05 — is set administratively by the City of Santa Barbara, as are transfer rules and liveaboard policy. Those terms have been stable, and a municipal landlord with a thousand-slip waitlist has little incentive to destabilize its own revenue base. But concentration risk is real: this position’s durability depends on one counterparty’s policy continuity, and honest analysis prices that in rather than around it.
The slip right and the right to live aboard are separate instruments. In Santa Barbara, as in most California harbors, liveaboard status is a capped, separately permitted layer on top of the slip permit — and it does not transfer as freely as the slip does. Anyone reading this ledger and concluding “buy a boat with a slip” without securing that second layer would be repeating, on water, the exact mistake this publication has documented on land: acquiring the asset while assuming the standing.
VI. What This Case Proves — and What It Doesn’t
This is one position, in one harbor, held by one household whose lifestyle fits a 35-foot interior. It is not a recommendation, and it scales to almost no one: Santa Barbara Harbor’s slip count is fixed, its liveaboard quota is smaller still, and the waitlist is measured in years. The economics documented here are, in part, a product of that scarcity — which means they cannot be replicated at scale, only secured individually, early, by those for whom the system aligns.
What the case does prove is narrower and more useful. It proves that in one of America’s most expensive coastal markets, there exists a legal, contractual, infrastructure-backed way to live directly on the water for approximately nine cents on the median homeowner’s dollar — and that the position comes with what almost no alternative-living arrangement offers: a transferable exit whose scarcest component is supported, not threatened, by the forces making the surrounding market unaffordable.
The house is a better asset. This is a better allocation — for the objectives it was chosen to serve.
Defining Insight
In Santa Barbara, $2.16 million buys proximity to the water. $259,000 buys the water itself — with the difference left over to be wealth instead of shelter.
Housing decisions are not only consumption decisions. They are capital allocation decisions.
Source Notes
- Santa Barbara South Coast and City of Santa Barbara sales data (May 2026 median $2,160,000; average $2,700,742; Montecito median $5,600,000; Hope Ranch average $7,140,000): County Recorder’s Office via Fidelity National Title, as reported in local market-trend analysis (Tabler, June 2026).
- Waterfront neighborhood average (~$2.96M): Redfin neighborhood data, Santa Barbara Waterfront.
- Average Santa Barbara rent ($2,836/mo): RentCafe.
- 30-year fixed mortgage rate (6.49%, week ending July 9, 2026): Freddie Mac Primary Mortgage Market Survey.
- Floating residence figures: author’s records — acquisition (2008 Meridian 35′, $150,000; slip rights including City transfer fees, $109,000); monthly slip fee $579.05; electricity $7.36; water included; maintenance and insurance budgeted at ~$500/mo; annual taxes ~$3,500.
- Home carrying-cost model assumptions (labeled as modeled, not actual): 20% down; 6.49% 30-year fixed; ~1.1% effective property tax; insurance estimated for the California coastal market; maintenance at 1% of home value annually. Mortgage P&I computed on $1,728,000 loan.
The Floating Residence researches floating living as a residential system — through geography, marina infrastructure, vessel suitability, financial structure, and lifestyle compatibility. This analysis is for informational purposes only and does not constitute legal, financial, tax, insurance, or real estate advice. Verify current City of Santa Barbara Waterfront Department policies, fees, and transfer rules before making any decision.